| .. | ||
| images | ||
| Allelica.py | ||
| LICENSE | ||
| populations.csv | ||
| readme.md | ||

🚀 Allelica




🧬 Allelica
Now, I know what you must be thinking — “Allelica? Who’s she?”
And no, Allelica is not a woman.
The name comes from allele — alternate forms of a gene.
🧠 Very Quick Genetics (I promise)
Okay… but what is a gene?
A gene is a segment of DNA that codes for proteins. DNA is the genetic material that stores information and passes it down generations.
Now imagine this:
- A gene is like a chapter in a book (say, eye colour), everyone had the same chapter
- The slightly different versions of that chapter? → alleles
And since you inherit one copy from each parent, you always have two alleles → this pair is your genotype.
👀 Simple Example
Let’s say:
- B → brown eyes (dominant)
- b → blue eyes (recessive)
Then:
- BB → brown
- Bb → brown (but carries blue)
- bb → blue
This is why two brown-eyed parents can still have a blue-eyed child.
🧬 Tiny Note (before a biologist attacks me)
Yes, this is simplified. Real genetics is messier. This is just enough for this project.
📐 The Math Side of Allelica
Allelica works on the Hardy–Weinberg principle.
p^2 + 2pq + q^2 = 1
Where:
- p = frequency of dominant allele
- q = frequency of recessive allele
And:
- p² → homozygous dominant
- 2pq → heterozygous
- q² → homozygous recessive
📊 Example
If:
- q = 0.3 → blue allele
- p = 0.7
Then:
- q² = 0.09 → 9% blue-eyed
- p² = 0.49 → 49% BB
- 2pq = 0.42 → 42% carriers
These values stay constant unless external factors interfere.
🤖 So… what does Allelica actually do?
She:
- Takes allele frequency data
- Calculates genotype frequencies using Hardy–Weinberg
- Compares and visualizes them across 4 populations
🌍 Why I made this
This started with me thinking:
“Does UV or altitude affect allele frequencies?”
Then I found real examples (like malaria resistance varying by region), and that turned into:
👉 let’s build something that visualizes this
This was originally my class 12 project (very ugly version). This is the upgraded one.
🎥 Preview
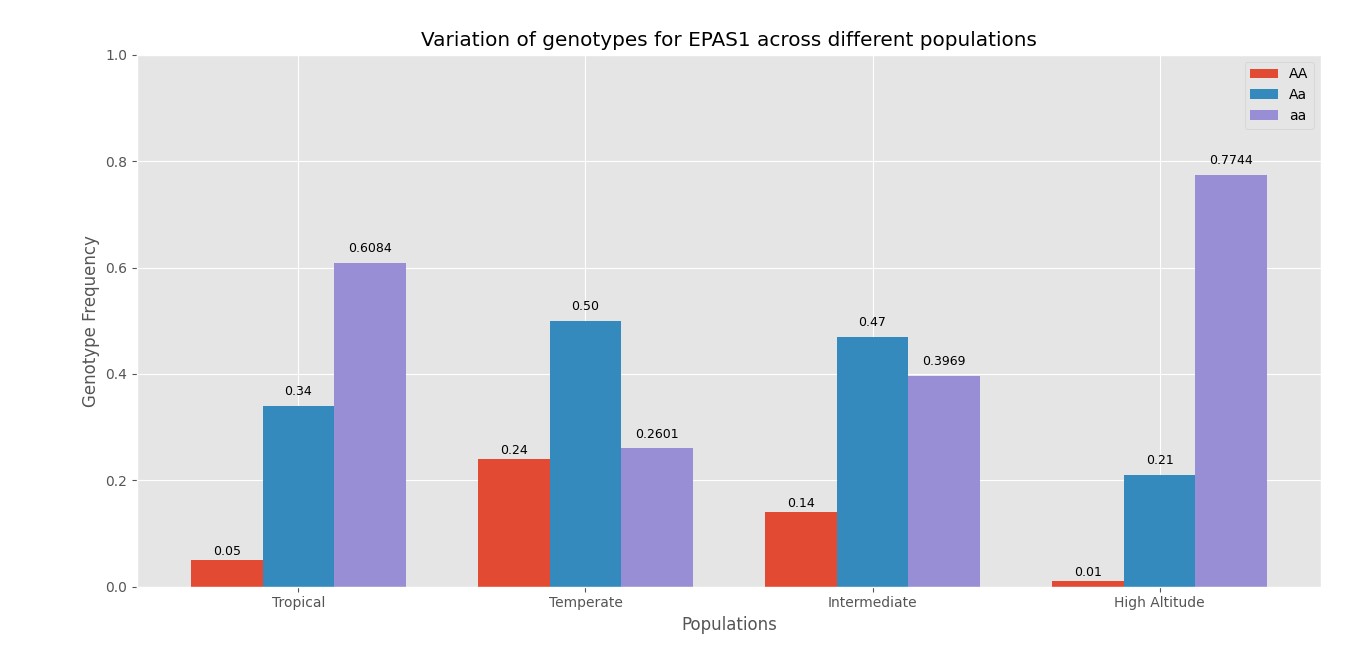
📊 Genotype Frequencies
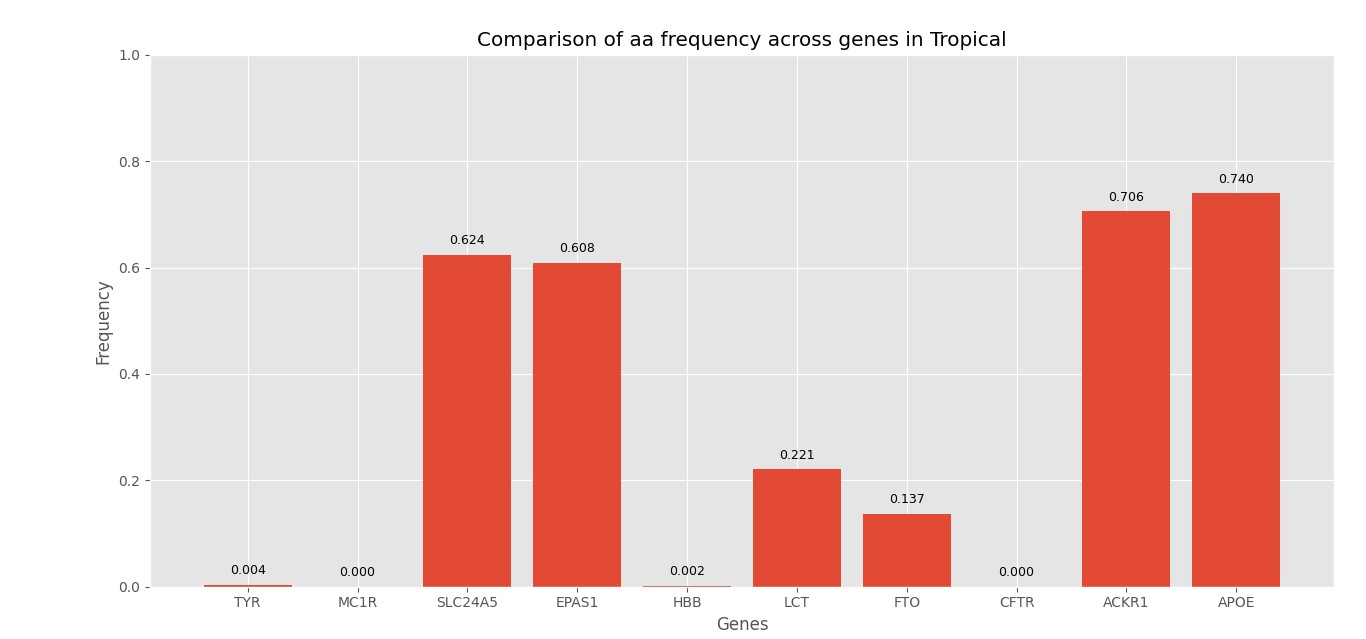
📊 Genotype Comparison
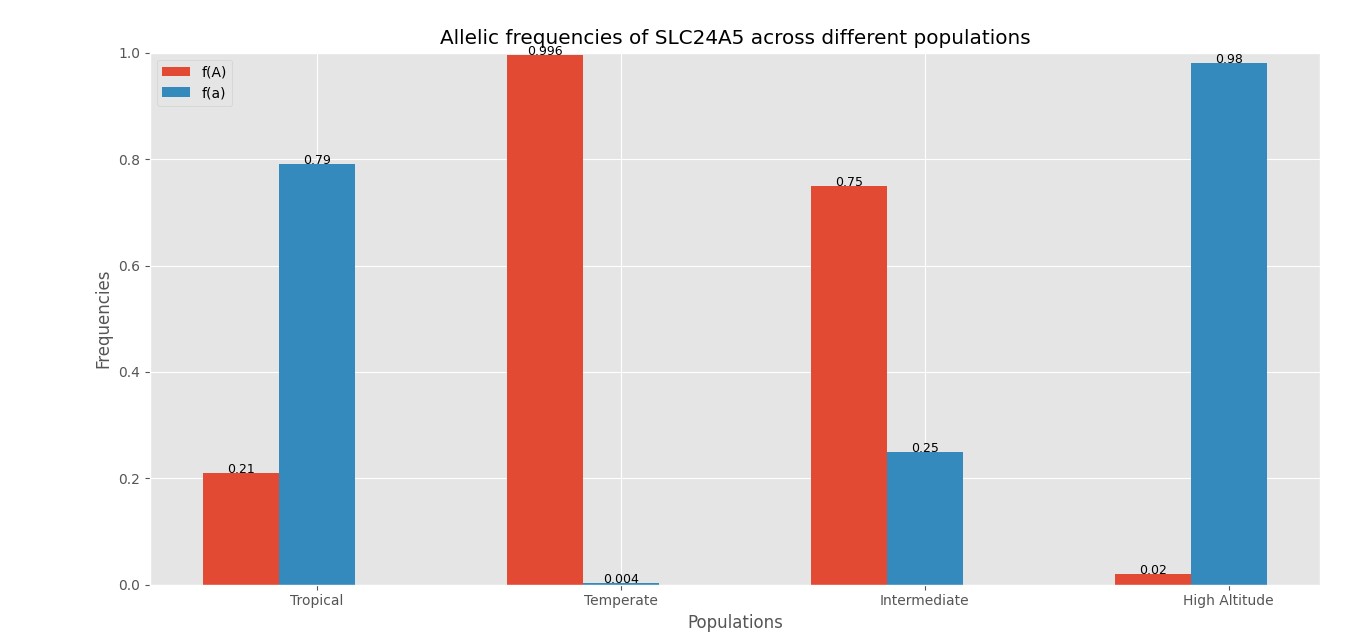
📈 Allele Frequencies
📊 Data Source
All allele frequency data was sourced from: gnomAD (Genome Aggregation Database)
| Gene | Trait | RS Number |
|---|---|---|
| TYR | Skin Pigmentation | rs1042602 |
| MC1R | Skin Pigmentation | rs1805007 |
| SLC24A5 | Skin Pigmentation | rs111310111 |
| EPAS1 | Altitude Adaptation | rs6743991 |
| HBB | Sickle Cell Trait | rs10768683 |
| LCT | Lactase Persistence | rs2304371 |
| FTO | Obesity Risk | rs62033438 |
| CFTR | Cystic Fibrosis | rs113993960 |
| ACKR1 | Malaria Resistance | rs2814778 |
| APOE | Alzheimers Risk | rs440446 |
⚙️ How to Run
Install dependencies:
pip install pandas numpy matplotlib
Run:
python Allelica.py
✨ Features
- 📊 Genotype frequency comparison across populations
- 🔬 Genotype comparison across genes
- 📈 Allele frequency visualization
- 📋 Console summaries with biological interpretation
- ✅ Input validation
- 💾 CSV output of results
🚀 Future Improvements
- 🗺️ v1.1 — Allele frequency heatmap across all genes and populations
- 🧬 v2.0 — BioPython integration for direct database querying instead of manual CSV input
- 🖤 v3.0 — Frontend interface (Allelica deserves to look as good as she works)
💡 Final Note
I could keep talking about genetics forever.
But this project is basically that — just with Python and graphs.